Design of data graphics (2001)Visualization Handbook (2004)Maps (2004)Spatiotemporal analysis (2006)Statistical Data Visualization (2008)Statistical Learning (2009)Interactive Data Visualization (2010)Visual Analytics (2010)Time-oriented data visualization (2011)Visual Analytics of Movement (2013)Visualization Analysis and Design (2014)Uncertainty, Multifield, Biomedical, and Scalable Visualization (2014)Multivariate visualization (1997)Visual data mining (2002)Flow feature extraction and tracking (2003)Visualizing spatial multivalue data (2005)Spatiotemporal aggregation (2005)Generalizing focus+context (2005)The role of interaction (2007)Visual analysis of time-oriented data (2008)Visual Analytics (2008)Multivariate scientific data vis (2009)Overview+detail, zooming, and focus+context (2009)Visual analysis of ensemble data (2009)Comparative visualization (2011)Time series data mining (2011)Illustrative flow visualization (2012)Visual analytics of movement (2013)Ensemble visualization challenges (2014)Uncertainty visualization (2014)Helix glyphs (2005)Flow maps (2011)ThemeRiver (2002)Time Histograms (2004)Chronovolumes (2003)Set and numerical operators (2006)Illustrative time visualization (2005)Illustrative flow visualization (2005)Comparative flow visualization (1997)Comparative flow visualization (2004)Two-tone coloring (2005)Visualization spreadsheets (2001)Interactive difference views (2010)Pixel-based multi-resolution techniques (2007)TimeSearcher (2004)TimeSearcher 2 (2005)Machine learning (2005)Time-dependent transfer function (2006)Line brushes (2006)Multi-level focus+context (2008)Hypothesis generation (2008)GeoAnalytics tools (2008)SignalLens (2010)Context-preserving visual links (2011)Cluster and calendar view (1999)Clustered climate data visualization (2004)Temporal Clustering Visualization Spreadsheet (2009)Self-organising maps (2008)Self-organizing maps (2010)PCA-based trend analysis (2006)PCA-based analysis of perfusion data (2007)KDE-based visualization of vessel movements (2009)KDE-based visualization of streaming data (2011)Local statistical complexity (2007)Wavelet Analysis (2009)Brushing scatterplot matices (1987)Parallel coordinates (1985)Task-specific visualization design (1999)Visual data fusion (2000)Layering (1999)Visual fusion (2002)Two-level volume rendering (2001)Importance-driven volume rendering (2005)Semantic layers (2007)Combining textures and colors (1999)Glyph-based visualization (2008)Glyph-based medical visualization (2011)Glyph-based visualization (2013)Tensor glyphs (2004)Glyph-based 3D data visualization (2009)XmdvTool (1994)WEAVE (2000)Polaris/Tableau (2002)SimVis (2003)Multifield-Graphs (2006)The grand tour (1985)ScatterDice (2008)Rank-by-feature framework (2004)Scagnostics (2005)Quality metrics (2009)Ranking and quality metrics (2011)Ranking and quality metrics (2011)Viewpoint selection (2006)Outlier-preserving focus+context (2006)Angular brushing (2002)Smooth brushing (2002)Cross-filtered views (2010)Multi-dimensional transfer functions (2002)Machine learning (2005)Human+machine learning (2009)Clustered parallel coordinates (2005)Multidimensional scaling (2003)Multidimensional scaling (2008)Attribute clouds (2008)Projection Methods (2015)Scattered data (1995)Function-based data model (1998)Data intermixing (1999)Multimodal volume rendering (2007)Multi-volume rendering (2004)Multi-volume shader framework (2007)Multi-volume rendering using BSP (2009)Contextual cutaways (2007)Multimodal registration (2003)Multimodal registration (2005)Image and data comparison metrics (1999)Image comparison metrics (2002)Image and data comparison metrics (2001)Multi-image view (2010)Comparison of climate data (2007)Nested surfaces (2005)Comparison of nested surfaces (2011)Surface similarity (2011)Box plot extension (2001)Summary plot (2010)Ovis (2014)Contour boxplots (2013)3D contour boxplots (2015)Curve boxplot (2014)Storm path ensembles (2015)Streamline variability plots (2016)Shape descriptors (2001)Density estimates (2002)Procedural operators (2005)Spaghetti plots (2002)EnsembleVis (2009)Noodles (2010)Isosurface uncertainty visualization (2011)Gradient uncertainty visualization (2013)Multimodal directional distributions (2015)Surface slicing (2012)Parameter space analysis (2014)Families of data surfaces (2009)Simulation model view (2010)Simulation process visualization (2009)Visual steering (2008)World lines (2010)Nodes on Ropes (2011)Brushing moments (2010)Heterogeneous data analysis (2011)HyperSlice (1993)HyperMoVal (2010)Uncertainty-aware exploration (2011)Parameter space exploration (2011)Vismon (2012)ParaGlide (2013)Comparison of Lagrangian transport (2013)Design by Dragging (2013)Comparing 2D function ensembles (2012)Multi-Charts (2014)Uncertainty-aware visual analysis (2009)Flow-based scatterplot (2010)Clustering PDFs (2004)Clustered parameter exploration (2010)Cupid (2014)Multi-model data analysis (2011)
| Design of data graphics (2001)by E.R. Tufte. |
---|
2nd ed. Graphics Press, 2001. |
| Visualization Handbook (2004)by C. Hansen and C. Johnson, Eds.. |
---|
Elsevier, 2004. |
| Maps (2004)by A. MacEachren. |
---|
Guilford Press, 2004. |
| Spatiotemporal analysis (2006)by N. Andrienko and G. Andrienko. |
---|
Springer, 2006. |
| Statistical Data Visualization (2008)by C.-h. Chen, W. Härdle, and A. Unwin, Eds.. |
---|
Springer, 2008. |
| Statistical Learning (2009)by T. Hastie, R. Tibshirani, and J. Friedman. |
---|
2nd ed. Springer, 2009. |
| Interactive Data Visualization (2010)by M.O. Ward, G. Grinstein, and D. Keim . |
---|
A.K. Peters, Ltd, 2010. |
| Visual Analytics (2010)by D. Keim, J. Kohlhammer, G. Ellis, and F. Mansmann, Eds.. |
---|
Eurographics Assoc., 2010. |
| Time-oriented data visualization (2011)by W. Aigner, S. Miksch, H. Schumann, and C. Tominski. |
---|
Springer, 2011. |
| Visual Analytics of Movement (2013)by G. Andrienko, N. Andrienko, P. Bak, D. Keim, and S. Wrobel. |
---|
Springer, 2013. |
| Visualization Analysis and Design (2014)by T. Munzner. |

---|
A.K. Peters/CRC Press, 2014. |
| Uncertainty, Multifield, Biomedical, and Scalable Visualization (2014)by C. Hansen, M. Chen, C. Johnson, A. Kaufman, H. Hagen, Eds.. |

---|
Springer, 2014. |
| Multivariate visualization (1997)by P.C. Wong and R.D. Bergeron. |
---|
Scientific Visualization: Overviews, Methodologies, and Techniques, pp. 3-33, 1997. |
| Visual data mining (2002)by D. Keim. |
---|
IEEE Trans. Visualization and Computer Graphics, vol. 8, no. 1, pp. 1-8, 2002. |
| Flow feature extraction and tracking (2003)by F. Post, B. Vrolijk, H. Hauser, R. Laramee, and H. Doleisch. |
---|
Computer Graphics Forum, vol. 22, no. 4, pp. 775-792, 2003. |
| Visualizing spatial multivalue data (2005)by A. Love, A. Pang, and D. Kao. |
---|
IEEE Computer Graphics and Applications, vol. 25, no. 3, pp. 69-79, 2005. |
| Spatiotemporal aggregation (2005)by I. López, R. Snodgrass, and B. Moon. |
---|
IEEE Trans. Knowl. Data Eng., vol. 17, no. 2, pp. 271-286, 2005. |
| Generalizing focus+context (2005)by H. Hauser. |
---|
Scientific Visualization: The Visual Extraction of Knowledge from Data, pp. 305-327, 2005. |
| The role of interaction (2007)by J.S. Yi, Y. a. Kang, J.T. Stasko, and J.A. Jacko. |
---|
IEEE Trans. Visualization and Computer Graphics, vol. 13, no. 6, pp. 1224-1231, 2007. |
| Visual analysis of time-oriented data (2008)by W. Aigner, S. Miksch, W. Müller, H. Schumann, and C. Tominski. |
---|
IEEE Trans. Visualization and Computer Graphics, vol. 14, no. 1, pp. 47-60, 2008. |
| Visual Analytics (2008)by D. Keim, G. Andrienko, J.-D. Fekete, C. Görg, J. Kohlhammer, and G. Melançon. |
---|
Information Visualization, vol. 4950, pp. 154-175, Springer, 2008. |
| Multivariate scientific data vis (2009)by R. Fuchs and H. Hauser. |
---|
Computer Graphics Forum, vol. 28, no. 6, pp. 1670-1690, 2009. |
| Overview+detail, zooming, and focus+context (2009)by A. Cockburn, A. Karlson, and B. Bederson. |
---|
ACM Computing Surveys, vol. 41, no. 1, pp. 2:1-2:31, 2009. |
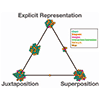
| Visual analysis of ensemble data (2009)by A. Wilson and K. Potter. |
---|
Proc. Ultrascale Visualization Workshop, pp. 48-53, 2009. |
| Comparative visualization (2011)by M. Gleicher, D. Albers, R. Walker, I. Jusufi, C. Hansen, and J. Roberts. |
---|
Information Visualization, vol. 10, no. 4, pp. 289–309, 2011. |
| Time series data mining (2011)by T.-C. Fu. |
---|
Eng. Appl. of Artificial Intelligence, vol. 24, no. 1, pp. 164-181, 2011. |
| Illustrative flow visualization (2012)by A. Brambilla, R. Carnecky, R. Peikert, I. Viola, and H. Hauser. |
---|
Eurographics 2012 – State of the Art Reports, pp. 75-94, 2012. |
| Visual analytics of movement (2013)by N. Andrienko and G. Andrienko. |
---|
Information Visualization, vol. 12, no. 1, pp. 3-24, 2013. |
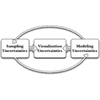
| Ensemble visualization challenges (2014)by H. Obermaier and K. Joy. |
---|
Computer Graphics and Applications, vol. 34, no. 3, pp. 8-11. |
| Uncertainty visualization (2014)by G.-P. Bonneau, H.-C. Hege, C. Johnson, M.M. Oliveira, K. Potter, P. Rheingans, and T. Schultz. |
---|
Scientific Visualization: Uncertainty, Multifield, Biomedical, and Scalable Visualization, pp. 3-27, 2014. |
| Helix glyphs (2005)by C. Tominski, P. Schulze-Wollgast, and H. Schumann. |
---|
Proc. Int'l. Conf. Information Visualization (IV), pp. 175-181, 2005. |
| Flow maps (2011)by N. Andrienko and G. Andrienko. |
---|
IEEE Trans. Visualization and Computer Graphics, vol. 17, no. 2, pp. 205-219, 2011. |
| ThemeRiver (2002)by S. Havre, E. Hetzler, P. Whitney, and L. Nowell. |
---|
IEEE Trans. Visualization and Computer Graphics, vol. 8, no. 1, pp. 9-20, 2002. |
| Time Histograms (2004)by R. Kosara, F. Bendix, and H. Hauser. |
---|
Proc. Symp. Data Visualization (VisSym), pp. 45-54, 2004. |
| Chronovolumes (2003)by J. Woodring and H.-W. Shen. |
---|
Proc. Symp. Data Visualization (VisSym), pp. 27-34, 2003. |
| Set and numerical operators (2006)by J. Woodring and H.-W. Shen. |
---|
IEEE Trans. Visualization and Computer Graphics, vol. 12, pp. 909-916, 2006. |
| Illustrative time visualization (2005)by A. Joshi and P. Rheingans. |
---|
Proc. IEEE Conf. Visualization, pp. 679-686, 2005. |
| Illustrative flow visualization (2005)by N.A. Svakhine, Y. Jang, D. Ebert, and K. Gaither. |
---|
Proc. IEEE Conf. Visualization, pp. 687-694, 2005. |
| Comparative flow visualization (1997)by H.-G. Pagendarm and F. Post. |
---|
Scientific Visualization: Overviews, Methodologies, and Techniques, pp. 211-227, 1997. |
| Comparative flow visualization (2004)by V. Verma and A. Pang. |
---|
IEEE Trans. Visualization and Computer Graphics, vol. 10, no. 6, pp. 609-624, 2004. |
| Two-tone coloring (2005)by T. Saito, H.N. Miyamura, M. Yamamoto, H. Saito, Y. Hoshiya, and T. Kaseda. |
---|
Proc. IEEE Symp. Information Visualization, pp. 173-180, 2005. |
| Visualization spreadsheets (2001)by T.J. Jankun-Kelly and K.-L. Ma. |
---|
IEEE Trans. Visualization and Computer Graphics, vol. 7, no. 3, pp. 275-287, 2001. |
| Interactive difference views (2010)by O. Daae Lampe, J. Kehrer, and H. Hauser. |
---|
Proc. Vision, Modeling, and Visualization (VMV), pp. 315-322, 2010. |
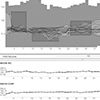
| Pixel-based multi-resolution techniques (2007)by M. Hao, D. Keim, U. Dayal, and T. Schreck. |
---|
Proc. Symp. Data Visualization (EuroVis), pp. 27-34, 2007. |
| TimeSearcher (2004)by H. Hochheiser and B. Shneiderman. |
---|
Information Visualization, vol. 3, no. 1, pp. 1-18, 2004. |
| TimeSearcher 2 (2005)by P. Buono, A. Aris, C. Plaisant, A. Khella, and B. Shneiderman. |
---|
Proc. Conf. Visualization and Data Analysis (VDA), pp. 175-18, 2005. |
| Machine learning (2005)by F.-Y. Tzeng and K.-L. Ma. |
---|
Proc. Int'l Conf. High Performance Computing, Networking, Storage and Analysis, 2005. |
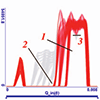
| Time-dependent transfer function (2006)by H. Akiba, N. Fout, and K.-L. Ma. |
---|
Proc. Symp. Data Visualization (EuroVis), pp. 171-178, 2006. |
| Line brushes (2006)by Z. Konyha, K. Matković, D. Gračanin, M. Jelović, and H. Hauser. |
---|
IEEE Trans. Visualization and Computer Graphics, vol. 12, no. 6, pp. 1373-1385, 2006. |
| Multi-level focus+context (2008)by P. Muigg, J. Kehrer, S. Oeltze, H. Piringer, H. Doleisch, B. Preim, and H. Hauser. |
---|
Computer Graphics Forum, vol. 27, no. 3, pp. 775-782, 2008. |
| Hypothesis generation (2008)by J. Kehrer, F. Ladstädter, P. Muigg, H. Doleisch, A. Steiner, and H. Hauser. |
---|
IEEE Trans. Visualization and Computer Graphics, vol. 14, no. 6, pp. 1579-1586, 2008. |
| GeoAnalytics tools (2008)by M. Jern, T. Åström, and S. Johansson. |
---|
Proc. Int'l. Conf. Information Visualization (IV), pp. 362-372, 2008. |
| SignalLens (2010)by R. Kincaid. |
---|
IEEE Trans. Visualization and Computer Graphics, vol. 16, no. 6, pp. 900-907, 2010. |
| Context-preserving visual links (2011)by M. Steinberger, M. Waldner, M. Streit, A. Lex, and D. Schmalstieg. |
---|
IEEE Trans. Visualization and Computer Graphics, vol. 17, no. 12, pp. 2249-2258, 2011. |
| Cluster and calendar view (1999)by J. van Wijk and E. van Selow. |
---|
Proc. IEEE Symp. Information Visualization, pp. 4-9, 1999. |
| Clustered climate data visualization (2004)by T. Nocke, H. Schumann, and U. Böhm. |
---|
Computational Statistics, vol. 19, no. 1, pp. 75-94, 2004. |
| Temporal Clustering Visualization Spreadsheet (2009)by J. Woodring and H.-W. Shen. |

---|
IEEE Trans. Visualization and Computer Graphics, vol. 15, no. 1, pp. 123-137, 2009. |
| Self-organising maps (2008)by P. Agarwal and A. Skupin, Eds.. |
---|
Wiley, 2008.Related publications: |
| Self-organizing maps (2010)by G. Andrienko, N. Andrienko, S. Bremm, T. Schreck, T. von Landesberger, P. Bak, and D. Keim. |
---|
Computer Graphics Forum, vol. 29, no. 3, pp. 913-922, 2010. |
| PCA-based trend analysis (2006)by W. Müller, T. Nocke, and H. Schumann. |
---|
Proc. Asia Pacific Symp. on Information Visualisation (APVIS '06), pp. 121-130, 2006. |
| PCA-based analysis of perfusion data (2007)by S. Oeltze, H. Doleisch, H. Hauser, P. Muigg, and B. Preim. |
---|
IEEE Trans. Visualization and Computer Graphics, vol. 13, no. 6, pp. 1392-1399, 2007. |
| KDE-based visualization of vessel movements (2009)by N. Willems, H. van de Wetering, and J. van Wijk. |
---|
Computer Graphics Forum, vol. 28, num. 3, pp. 959-966, 2009. |
| KDE-based visualization of streaming data (2011)by O. Daae Lampe and H. Hauser. |
---|
Proc. IEEE Pacific Visualization Symp., pp. 171-178, 2011. |
| Local statistical complexity (2007)by H. Jänicke, A. Wiebel, G. Scheuermann, and W. Kollmann. |
---|
IEEE Trans. Visualization and Computer Graphics, vol. 13, no. 6, pp. 1384-1391, 2007. |
| Wavelet Analysis (2009)by H. Jänicke, M. Böttinger, U. Mikolajewicz, and G. Scheuermann. |
---|
IEEE Trans. Visualization and Computer Graphics, vol. 15, no. 6, pp. 1375-1382, 2009. |
| Brushing scatterplot matices (1987)by R. Becker and W. Cleveland. |
---|
Technometrics, vol. 29, no. 2, pp. 127-142, 1987. |
| Parallel coordinates (1985)by A. Inselberg. |
---|
The Visual Computer, vol. 1, no. 2, pp. 69-91, 1985. |
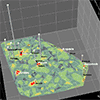
| Task-specific visualization design (1999)by L. Treinish. |
---|
IEEE Computer Graphics and Applications, vol. 19, no. 5, pp. 72-77, 1999. |
| Visual data fusion (2000)by L. Treinish. |
---|
Proc. IEEE Conf. Visualization, pp. 477-480, 2000. |
| Layering (1999)by R. Kirby, H. Marmanis, and D. Laidlaw. |
---|
Proc. IEEE Visualization, pp. 333-340, 1999. |
| Visual fusion (2002)by P.C. Wong, H. Foote, D.L. Kao, R. Leung, and J. Thomas. |
---|
Information Visualization, vol. 1, no. 3/4, pp. 182-193, 2002. |
| Two-level volume rendering (2001)by H. Hauser, L. Mroz, G.-I. Bischi, and M.E. Gröller. |
---|
IEEE Trans. Visualization and Computer Graphics, vol. 7, no. 3, pp. 242-252, 2001. |
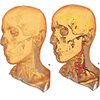
| Importance-driven volume rendering (2005)by I. Viola, A. Kanitsar, and M.E. Gröller. |
---|
IEEE Trans. Visualization and Computer Graphics, vol. 11, no. 4, pp. 408-418, 2005. |
| Semantic layers (2007)by P. Rautek, S. Bruckner, and M.E. Gröller. |
---|
IEEE Trans. Visualization and Computer Graphics, vol. 13, pp. 1336-1343, 2007. |
| Combining textures and colors (1999)by C. Healey and J. Enns. |
---|
IEEE Trans. Visualization and Computer Graphics, vol. 5, no. 2, pp. 145-167, 1999. |
| Glyph-based visualization (2008)by M.O. Ward. |
---|
Handbook of Data Visualization, C.-H. Chen, W. Härdle, and A. Unwin, Eds., pp. 179-198. Springer, 2008. |
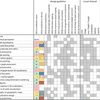
| Glyph-based medical visualization (2011)by T. Ropinski, S. Oeltze, and B. Preim. |
---|
Computers & Graphics, vol. 35, no. 2, pp. 392-401, 2011. |
| Glyph-based visualization (2013)by R. Borgo, J. Kehrer, D.H.S. Chung, E. Maguire, R.S. Laramee, H. Hauser, M.O. Ward, and M. Chen. |
---|
Eurographics 2013 – State of the Art Reports, pp. 39-63, 2013. |
| Tensor glyphs (2004)by G. Kindlmann. |
---|
Proc. Symp. Data Visualization (VisSym), pp. 147-154, 2004. |
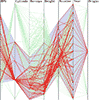
| Glyph-based 3D data visualization (2009)by A.E. Lie, J. Kehrer, and H. Hauser. |
---|
Proc. Spring Conf. Computer Graphics (SCCG), pp. 27-34, 2009. |
| XmdvTool (1994)by M.O. Ward. |
---|
Proc. IEEE Conf. Visualization, pp. 326-336, 1994. |
| WEAVE (2000)by D. Gresh, B. Rogowitz, R. Winslow, D. Scollan, and C. Yung. |
---|
Proc. IEEE Conf. Visualization, pp. 489-492, 2000. |
| Polaris/Tableau (2002)by C. Stolte, D. Tang, and P. Hanrahan. |
---|
IEEE Trans. Visualization and Computer Graphics, vol. 8, no. 1, pp. 52-65, 2002. |
| SimVis (2003)by H. Doleisch, M. Gasser, and H. Hauser. |
---|
Proc. Symp. Data Visualization (VisSym), pp. 239-248, 2003. |
| Multifield-Graphs (2006)by N. Sauber, H. Theisel, and H.-P. Seidel. |
---|
IEEE Trans. Visualization and Computer Graphics, vol. 12, no. 5, pp. 917-924, 2006. |
| The grand tour (1985)by D. Asimov. |
---|
SIAM J. Scientific and Statistical Computing, vol. 6, pp. 128-143, 1985.Related publications: |
| ScatterDice (2008)by N. Elmqvist, P. Dragicevic, and J.-D. Fekete. |
---|
IEEE Trans. Visualization and Computer Graphics, vol. 14, no. 6, pp. 1539-1148, 2008. |
| Rank-by-feature framework (2004)by J. Seo and B. Shneiderman. |
---|
Proc. IEEE Symp. Information Visualization, pp. 65-72, 2004. |
| Scagnostics (2005)by L. Wilkinson, A. Anand, and R. Grossman. |
---|
Proc. IEEE Symp. Information Visualization, pp. 157-164, 2005. |
| Quality metrics (2009)by S. Johansson and J. Johansson. |
---|
IEEE Trans. Visualization and Computer Graphics, vol. 15, no. 6, pp. 993-1000, 2009. |
| Ranking and quality metrics (2011)by A. Tatu, G. Albuquerque, M. Eisemann, P. Bak, H. Theisel, M. Magnor, and D. Keim. |
---|
IEEE Trans. Visualization and Computer Graphics, vol. 17, no. 5, pp. 584-597, 2011. |
| Ranking and quality metrics (2011)by E. Bertini, A. Tatu, and D. Keim. |
---|
IEEE Trans. Visualization and Computer Graphics, vol. 17, no. 12, pp. 2203-2212, 2011. |
| Viewpoint selection (2006)by I. Viola, M. Feixas, M. Sbert, and M.E. Gröller. |
---|
IEEE Trans. Visualization and Computer Graphics, vol. 12, pp. 933-940, 2006. |
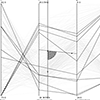
| Outlier-preserving focus+context (2006)by M. Novotný and H. Hauser. |
---|
IEEE Trans. Visualization and Computer Graphics, vol. 12, no. 5, pp. 893-900, 2006. |
| Angular brushing (2002)by H. Hauser, F. Ledermann, and H. Doleisch. |
---|
Proc. IEEE Symp. Information Visualization, pp. 127-130, 2002. |
| Smooth brushing (2002)by H. Doleisch and H. Hauser. |
---|
J. WSCG, vol. 10, no. 1, pp. 147-154, 2002. |
| Cross-filtered views (2010)by C. Weaver. |
---|
IEEE Trans. Visualization and Computer Graphics, vol. 16, no. 2, pp. 192-204, 2010. |
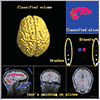
| Multi-dimensional transfer functions (2002)by J. Kniss, G. Kindlmann, and C. Hansen. |
---|
IEEE Trans. Vis. Comput. Graph., vol. 8, no. 3, pp. 270-285, 2002. |
| Machine learning (2005)by F.-Y. Tzeng, E. Lum, and K.-L. Ma. |
---|
IEEE Trans. Visualization and Computer Graphics, vol. 11, no. 3, pp. 273-284, 2005. |
| Human+machine learning (2009)by R. Fuchs, J. Waser, and M.E. Gröller. |
---|
IEEE Trans. Visualization and Computer Graphics, vol. 15, no. 6, pp. 1327-1334, 2009. |
| Clustered parallel coordinates (2005)by J. Johansson, P. Ljung, M. Jern, and M. Cooper. |
---|
Proc. IEEE Symp. Information Visualization, pp. 125-132, 2005. |
| Multidimensional scaling (2003)by A. Morrison, G. Ross, and M. Chalmers. |
---|
Information Visualization, vol. 2, no. 1, pp. 68-77, 2003. |
| Multidimensional scaling (2008)by A. Buja, D. Swayne, M. Littman, N. Dean, H. Hofmann, and L. Chen. |
---|
J. Computational and Graphical Statistics, vol. 17, no. 2, pp. 444-472, 2008. |
| Attribute clouds (2008)by H. Jänicke, M. Böttinger, and G. Scheuermann. |
---|
IEEE Trans. Visualization and Computer Graphics, vol. 14, no. 6, pp. 1459-1466, 2008. |
| Projection Methods (2015)by R. Etemadpour, R. Motta, J.G. de Souza Paiva, R. Minghim, M.C.F. de Oliveira, and Lars Linsen. |
---|
IEEE Trans. Visualization and Computer Graphics, vol. 21, no. 1, pp. 81-94, 2015. |
| Scattered data (1995)by L. Treinish. |
---|
IEEE Computer Graphics and Applications, vol. 15, no. 4, pp. 20-26, 1995. |
| Function-based data model (1998)by L. Treinish. |
---|
Proc. IEEE Conf. Visualization, pp. 73-76, 1998. |
| Data intermixing (1999)by W. Cai and G. Sakas. |
---|
Computer Graphics Forum, vol. 18, no. 3, pp. 359-368, 1999. |
| Multimodal volume rendering (2007)by J. Beyer, M. Hadwiger, S. Wolfsberger, and K. Bühler. |
---|
IEEE Trans. Visualization and Computer Graphics, vol. 13, no. 6, pp. 1696-1703, 2007. |
| Multi-volume rendering (2004)by S. Grimm, S. Bruckner, A. Kanitsar, and M.E. Gröller. |
---|
Proc. Vision, Modeling, and Visualization (VMV), pp. 386-379, 2004. |
| Multi-volume shader framework (2007)by J. Plate, T. Holtkämper, and B. Fröhlich. |
---|
IEEE Trans. Visualization and Computer Graphics, vol. 13, no. 6, pp. 1584-1591, 2007. |
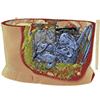
| Multi-volume rendering using BSP (2009)by S. Lindholm, P. Ljung, M. Hadwiger, and A. Ynnerman. |
---|
Computer Graphics Forum, vol. 28, no. 3, pp. 847-854, 2009. |
| Contextual cutaways (2007)by M. Burns, M. Haidacher, W. Wein, I. Viola, and M.E. Gröller. |
---|
Proc. Symp. Data Visualization (EuroVis), pp. 275-282, 2007. |
| Multimodal registration (2003)by J.P.W. Pluim, J.B.A. Maintz, and M.A. Viergever. |
---|
IEEE Trans. Medical Imaging, vol. 22, no. 8, pp. 986-1004, 2003. |
| Multimodal registration (2005)by A. Ardeshir Goshtasby. |
---|
Wiley, 2005. |
| Image and data comparison metrics (1999)by N. Sahasrabudhe, J. West, R. Machiraju, and M. Janus. |
---|
Proc. IEEE Conf. Visualization, pp. 97-515, 1999. |
| Image comparison metrics (2002)by H. Zhou, M. Chen, and M. Webster. |
---|
Proc. IEEE Visualization, pp. 315-322, 2002. |
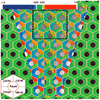
| Image and data comparison metrics (2001)by K. Kim, C. Wittenbrink, and A. Pang. |
---|
IEEE Trans. Visualization and Computer Graphics, vol. 7, no. 4, pp. 299-317, 2001. |
| Multi-image view (2010)by M. Malik, C. Heinzl, and M.E. Gröller. |
---|
IEEE Trans. Visualization and Computer Graphics, vol. 16, no. 5, pp. 829-840, 2010. |
| Comparison of climate data (2007)by T. Nocke, M. Flechsig, and U. Böhm. |
---|
Proc. Winter Simulation Conf., pp. 703-711, 2007. |
| Nested surfaces (2005)by C. Weigle and R. Taylor II. |
---|
Proc. IEEE Conf. Visualization, pp. 503-510, 2005. |
| Comparison of nested surfaces (2011)by S. Busking, C. Botha, L. Ferrarini, J. Milles, and F. Post. |
---|
The Visual Computer, vol. 27, pp. 347-363, 2011. |
| Surface similarity (2011)by M. Haidacher, S. Bruckner, and M.E. Gröller. |
---|
IEEE Trans. Visualization and Computer Graphics, vol. 17, no. 12, pp. 1969-1978, 2011.Related publications: |
| Box plot extension (2001)by D. Kao, J. Dungan, and A. Pang. |
---|
Proc. IEEE Conf. Visualization, pp. 457-460, 2001. |
| Summary plot (2010)by K. Potter, J. Kniss, R. Riesenfeld, and C. Johnson. |
---|
Computer Graphics Forum, vol. 29, no. 3, pp. 823-832, 2010. |
| Ovis (2014)by T. Höllt, A. Magdy, P. Zhan, G. Chen, G. Gopalakrishnan, I. Hoteit, C. Hansen, and M. Hadwiger. |
---|
IEEE Trans. Visualization and Computer Graphics, vol. 20, no. 8, pp. 1114-1126, 2014. |
| Contour boxplots (2013)by R.T. Whitaker, M. Mirzargar, and R.M. Kirby. |
---|
IEEE Trans. Visualization and Computer Graphics, vol. 19, no. 12, pp. 2713-2722, 2013. |
| 3D contour boxplots (2015)by M. Raj, M. Mirzargar, J.S. Preston, R.M. Kirby, R.T. Whitaker. |
---|
IEEE Computer Graphics and Applications, accepted. |
| Curve boxplot (2014)by M. Mirzargar, R.T. Whitaker, and R.M. Kirby. |
---|
IEEE Trans. Visualization and Computer Graphics, vol. 20, no. 12, 2014. |
| Storm path ensembles (2015)by L. Liu, M. Mirzangar, R.M. Kirby, R. Whitaker, and D.H. House. |
---|
Computer Graphics Forum, vol. 34, no. 3, 2015. |
| Streamline variability plots (2016)by F. Ferstl, K. Bürger, and R. Westermann. |
---|
IEEE Trans. Visualization and Computer Graphics, vol. 22, no. 1, pp. 767-776, 2016. |
| Shape descriptors (2001)by D. Kao, J. Dungan, and A. Pang. |
---|
Proc. IEEE Conf. Visualization, pp. 457-460, 2001. |
| Density estimates (2002)by D. Kao, A. Luo, J. Dungan, and A. Pang. |
---|
Proc. Int’l. Conf. Information Visualization (IV), pp. 219-225, 2002. |
| Procedural operators (2005)by A. Love, A. Pang, and D. Kao. |
---|
IEEE Computer Graphics and Applications, vol. 25, no. 3, pp. 69-79, 2005. |
| Spaghetti plots (2002)by P. Diggle, P. Heagerty, K.-Y. Liang, and S. Zeger. |
---|
Oxford University Press, 2002. |
| EnsembleVis (2009)by K. Potter, A. Wilson, P.-T. Bremer, D. Williams, C. Doutriaux, V. Pascucci, and C. Johnson. |
---|
Proc. IEEE Int'l. Conf. on Data Mining Workshops, pp. 233-240, 2009. |
| Noodles (2010)by J. Sanyal, S. Zhang, J. Dyer, A. Mercer, P. Amburn, and R. Moorhead. |
---|
IEEE Trans. Visualization and Computer Graphics, vol. 16, no. 6, pp. 1421-1430, 2010. |
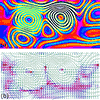
| Isosurface uncertainty visualization (2011)by T. Pfaffelmoser, M. Reitinger, and R. Westermann. |
---|
Computer Graphics Forum, vol. 30, no. 3, pp. 951-960, 2011. |
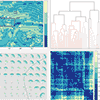
| Gradient uncertainty visualization (2013)by T. Pfaffelmoser, M. Mihai, and R. Westermann. |
---|
IEEE Trans. Visualization and Computer Graphics, vol. 19, no. 11, pp. 1948-1961, 2013. |
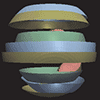
| Multimodal directional distributions (2015)by M. Jarema, I. Demir, J. Kehrer, R. Westermann. |
---|
Proc. IEEE Symp. Visual Analytics Science and Technology (VAST), 2015. |
| Surface slicing (2012)by O.S. Alabi, X. Wu, J.M. Harter, M. Phadke, L. Pinto, H. Petersen, S. Bass, M. Keifer, S. Zhong, C.G. Healey, and R.M. Taylor. |
---|
Proc. SPIE 8294, Visualization and Data Analysis, vol. 8294, 2012. |
| Parameter space analysis (2014)by M. Sedlmair, C. Heinzl, S. Bruckner, H. Piringer, T. Möller. |
---|
IEEE Trans. Visualization and Computer Graphics, vol. 20, no. 12, 2014. |
| Families of data surfaces (2009)by K. Matković, D. Gračanin, B. Klarin, and H. Hauser. |
---|
IEEE Trans. Visualization and Computer Graphics, vol. 15, no. 6, pp. 1351-1358, 2009. |
| Simulation model view (2010)by K. Matković, D. Gračanin, M. Jelović, A. Ammer, A. Lež, and H. Hauser. |
---|
IEEE Trans. Visualization and Computer Graphics, vol. 16, no. 6, pp. 1449-1457, 2010. |
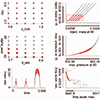
| Simulation process visualization (2009)by A. Unger and H. Schumann. |
---|
Proc. IEEE Pacific Visualization Symp., pp. 57-64, 2009. |
| Visual steering (2008)by K. Matković, D. Gračanin, M. Jelović, and H. Hauser. |
---|
IEEE Trans. Visualization and Computer Graphics, vol. 14, no. 6, pp. 1699-1706, 2008. |
| World lines (2010)by J. Waser, R. Fuchs, H. Ribicic, B. Schindler, G. Blöschl, and M.E. Gröller. |
---|
IEEE Trans. Visualization and Computer Graphics, vol. 16, no. 6, pp. 1458-1467, 2010. |
| Nodes on Ropes (2011)by J. Waser, H. Ribičić, R. Fuchs, C. Hirsch, B. Schindler, G. Blöschl, and M.E. Gröller. |
---|
IEEE Trans. Visualization and Computer Graphics, vol. 17, no. 12, pp. 1872-1881, 2011.Related publications: |
| Brushing moments (2010)by J. Kehrer, P. Filzmoser, and H. Hauser. |
---|
Computer Graphics Forum, vol. 29, no. 3, pp. 813-822, 2010. |
| Heterogeneous data analysis (2011)by J. Kehrer, P. Muigg, H. Doleisch, and H. Hauser. |
---|
IEEE Trans. Visualization and Computer Graphics, vol. 17, no. 7, pp. 934-946, 2011. |
| HyperSlice (1993)by J. van Wijk and R. van Liere. |
---|
Proc. IEEE Conf. Visualization, pp. 119-125, 1993. |
| HyperMoVal (2010)by H. Piringer, W. Berger, and J. Krasser. |
---|
Computer Graphics Forum, vol. 29, no. 3, pp. 983-992, 2010. |
| Uncertainty-aware exploration (2011)by W. Berger, H. Piringer, P. Filzmoser, and M.E. Gröller. |
---|
Computer Graphics Forum, vol. 30, no. 3, pp. 911-920, 2011. |
| Parameter space exploration (2011)by T. Torsney-Weir, A. Saad, T. Möller, H.-C. Hege, B. Weber, and J.-M. Verbavatz. |
---|
IEEE Trans. Visualization and Computer Graphics, vol. 17, no. 12, 1892-1901, 2011. |
| Vismon (2012)by M. Booshehrian, T. Möller, R.M. Peterman, and T. Munzner. |
---|
Computer Graphics Forum, vol. 31, no. 3, pp. 1235-1244, 2012. |
| ParaGlide (2013)by S. Bergner, M. Sedlmair, T. Möller, S.N. Abdolyousefi, and A. Saad. |
---|
IEEE Trans. Visualization and Computer Graphics, vol. 19, no. 9, 1499-1412, 2013. |
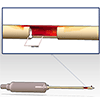
| Comparison of Lagrangian transport (2013)by M. Hummel, H. Obermaier, C. Garth, and K.I. Joy. |
---|
IEEE Trans. Visualization and Computer Graphics, vol. 19, no. 12, 2743-2752, 2013. |
| Design by Dragging (2013)by D. Coffey, C.-L. Lin, A.G. Erdman, and D.F. Keefe. |
---|
IEEE Trans. Visualization and Computer Graphics, vol. 19, no. 12, 2783-2791, 2013. |
| Comparing 2D function ensembles (2012)by H. Piringer, S. Pajer, W. Berger, and H. Teichmann. |
---|
Computer Graphics Forum, vol. 31, no. 3, pp. 1195-1204, 2012. |
| Multi-Charts (2014)by I. Demir, C. Dick, and R. Westermann. |
---|
IEEE Trans. Visualization and Computer Graphics, vol. 20, no. 12, 2014. |
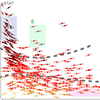
| Uncertainty-aware visual analysis (2009)by C. Correa, Y.-H. Chan, and K.-L. Ma. |
---|
Proc. IEEE Symp. Visual Analytics Science and Technology (VAST), pp. 51-58, 2009. |
| Flow-based scatterplot (2010)by Y.-H. Chan, C. Correa, and K.-L. Ma. |
---|
Proc. IEEE Symp. Visual Analytics Science and Technology (VAST), pp. 43-50, 2010. |
| Clustering PDFs (2004)by U.D. Bordoloi, D.L. Kao, and H.-W. Shen. |
---|
Data Science J., vol. 3, pp. 153-162, 2004. |
| Clustered parameter exploration (2010)by S. Bruckner and T. Möller. |
---|
IEEE Trans. Visualization and Computer Graphics, vol. 16, no. 6, pp. 1468-1476, 2010. |
| Cupid (2014)by M. Beham, W. Herzner, M.E. Gröller, and J. Kehrer. |
---|
IEEE Trans. Visualization and Computer Graphics, vol. 20, no. 12, 2014. |
| Multi-model data analysis (2011)by J. Kehrer, P. Muigg, H. Doleisch, and H. Hauser. |
---|
IEEE Trans. Visualization and Computer Graphics, vol. 17, no. 7, pp. 934-946, 2011. |
All rights for the technique images belong to their respective owners. Did we miss your technique? Do you want to suggest corrections? Please email us.